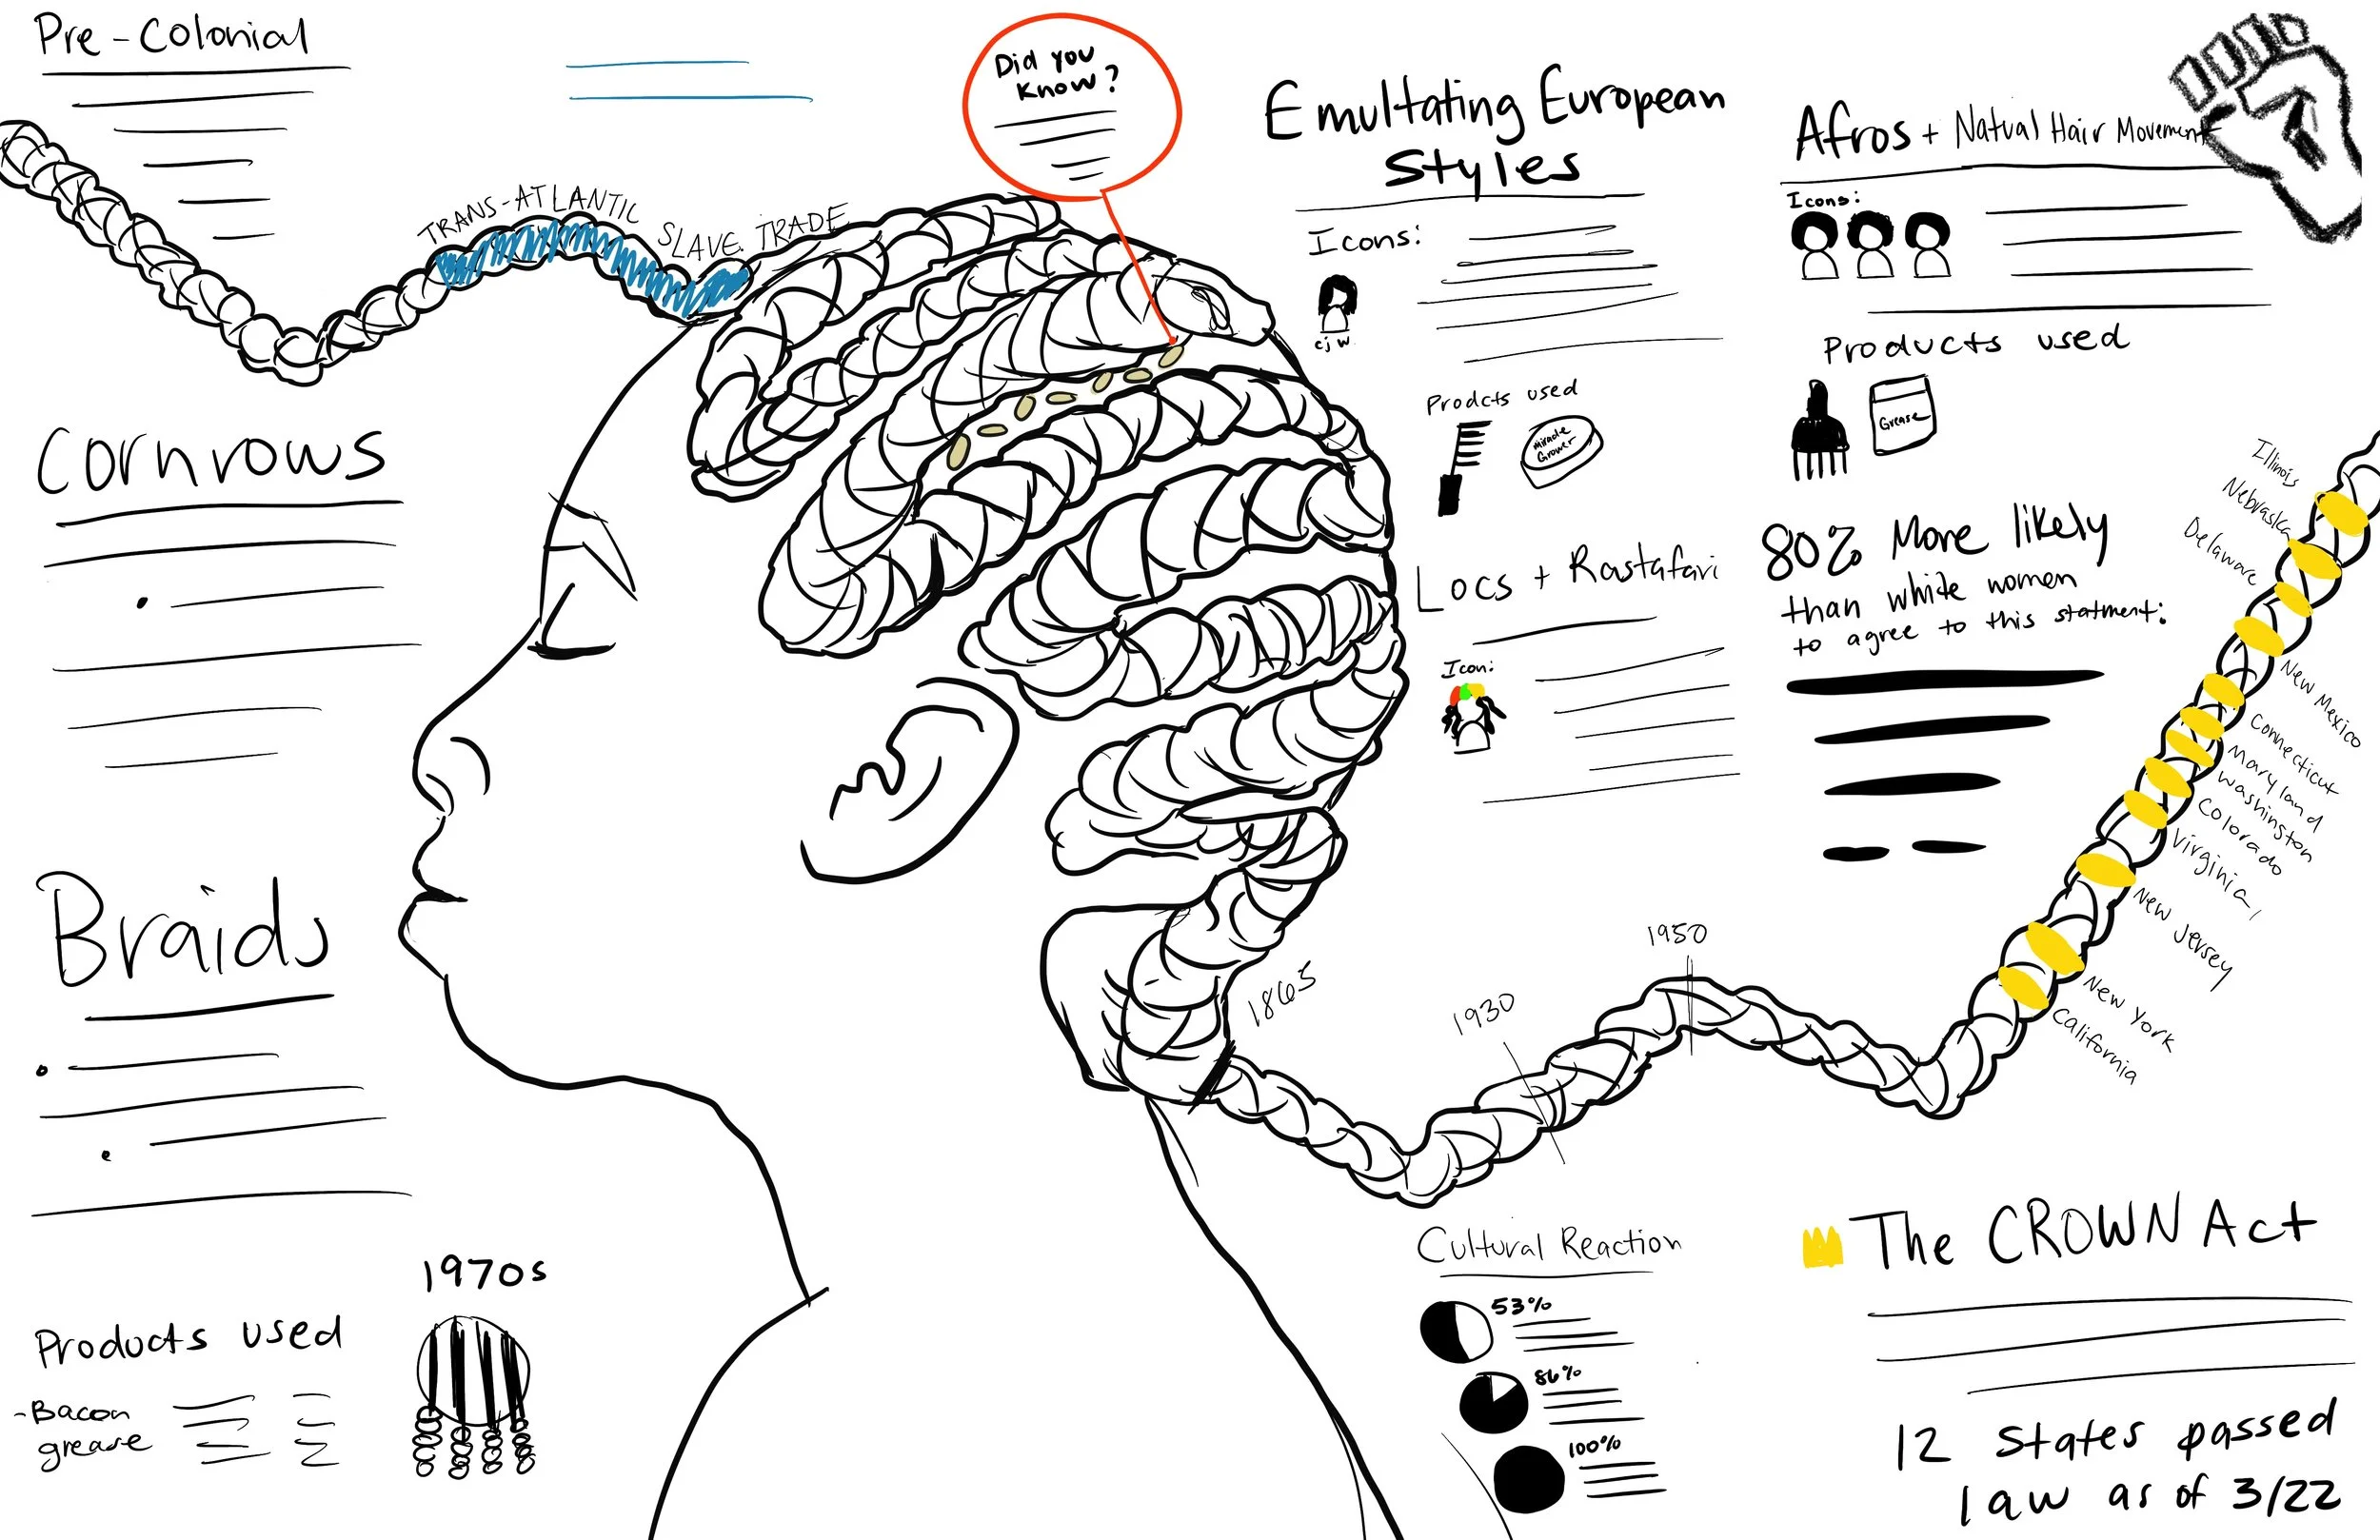
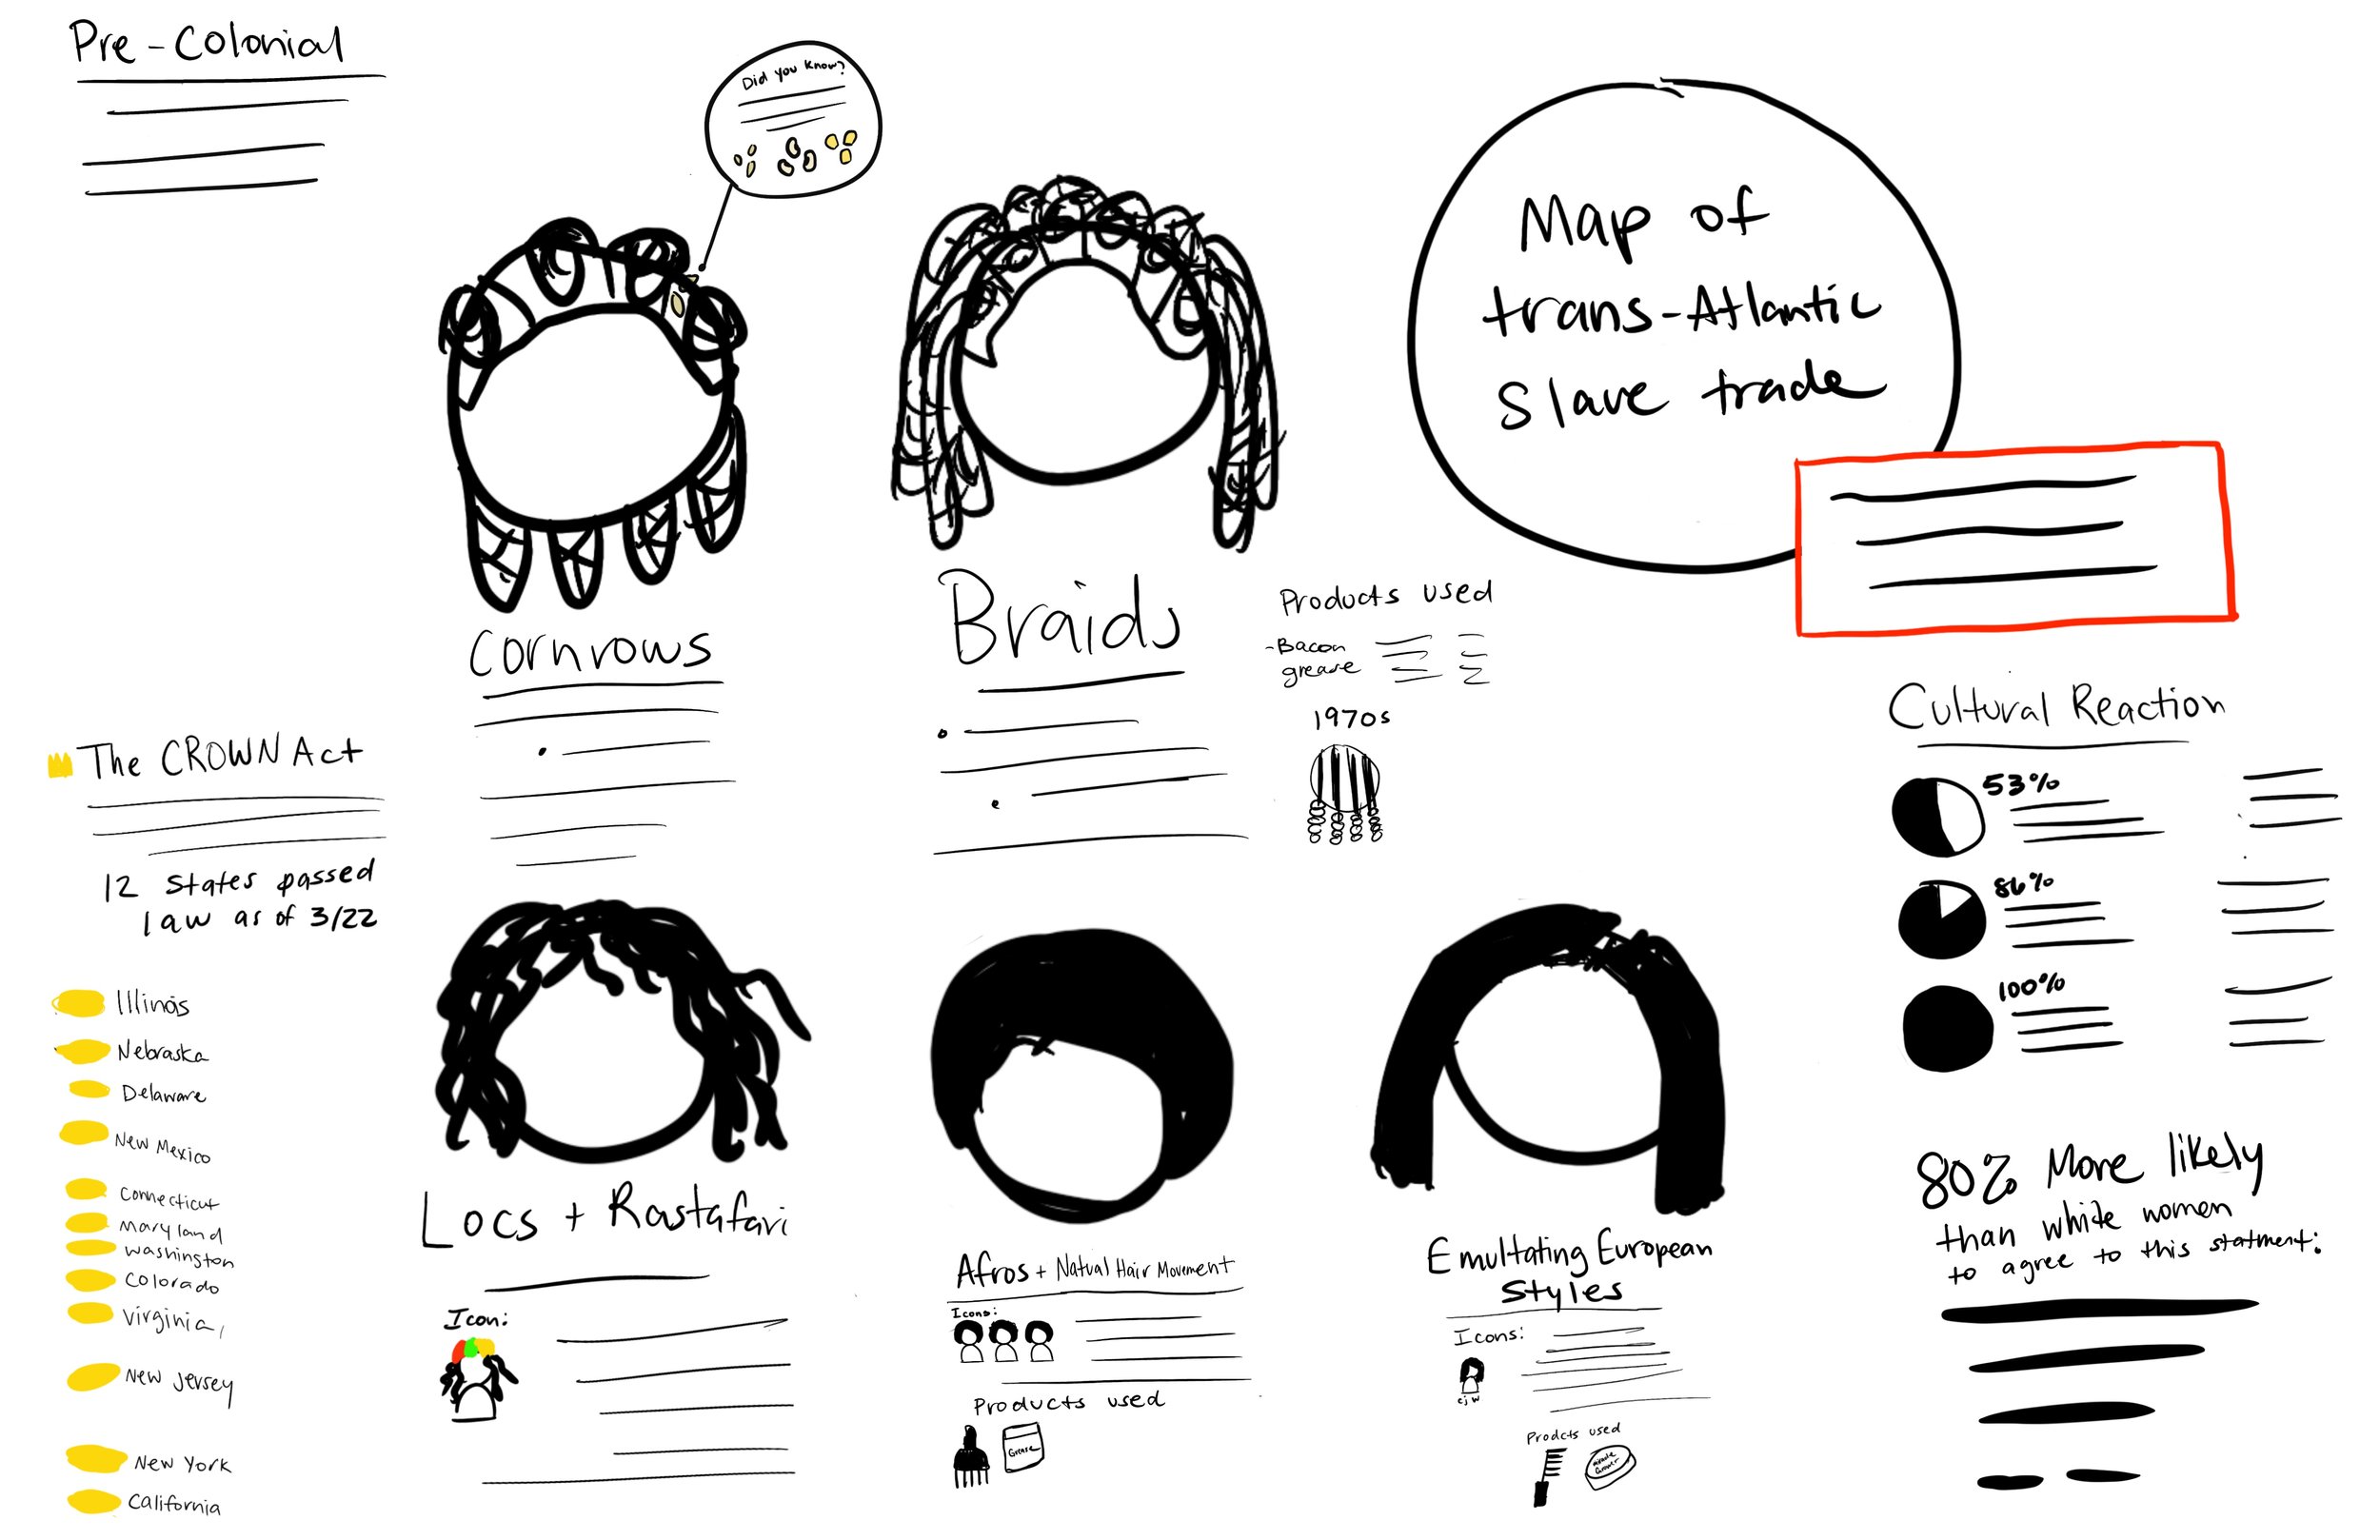
RESILIENT ROOTS

Infographic, Class Project
Using data visualization tools to make an infographic on a personally determined topic surrounding the theme of culture.
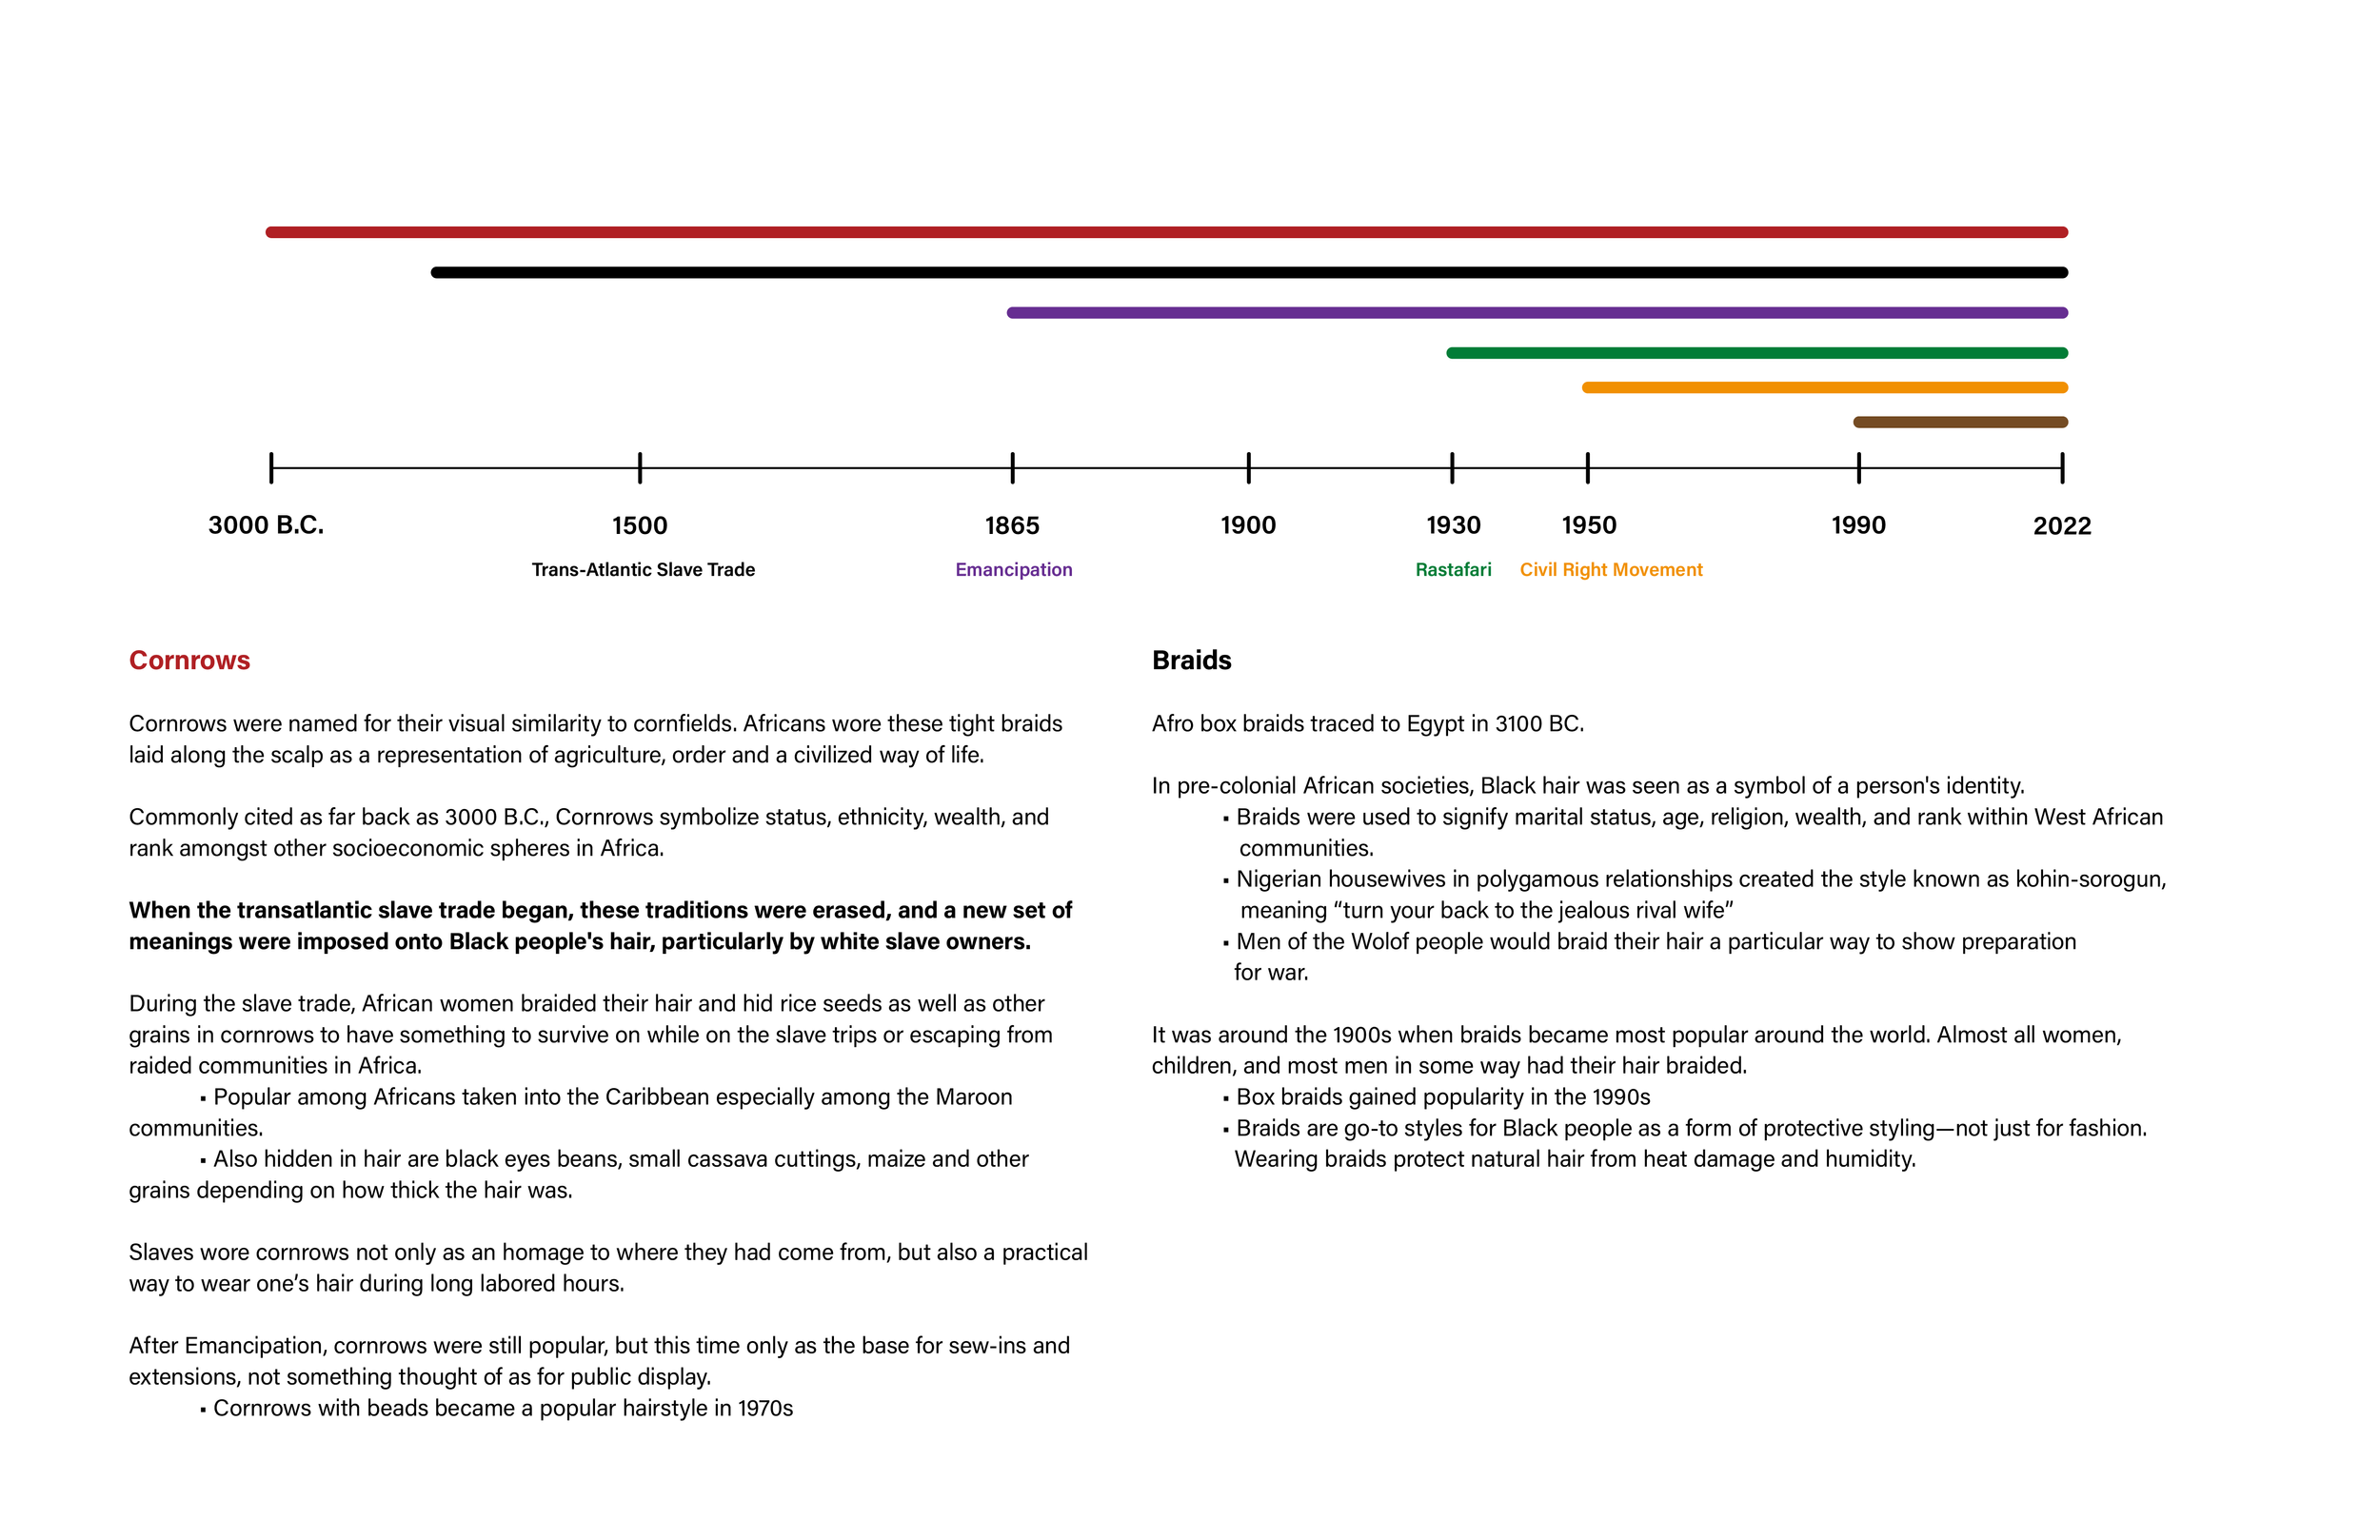
Categorization
Collected 75 pieces of information from articles for use within my infographic. Categorized this information — use color coding and chunking to make it easy to access.